Data generation
First, we generate a dataset with the peerannot simulate command. This dataset has 30 workers, 200 tasks for 5 classes. Each task receives 10 votes.
[1]:
from pathlib import Path
path = (Path() / ".." / "_build" / "notebooks")
path.mkdir(exist_ok=True, parents=True)

! peerannot simulate --n-worker=30 --n-task=200  --n-classes=5 \
                     --strategy independent-confusion \
                     --feedback=10 --seed 0 \
                     --folder ../_build/notebooks/
    Saved answers at ../_build/notebooks/answers.json

    Saved ground truth at ../_build/notebooks/ground_truth.npy
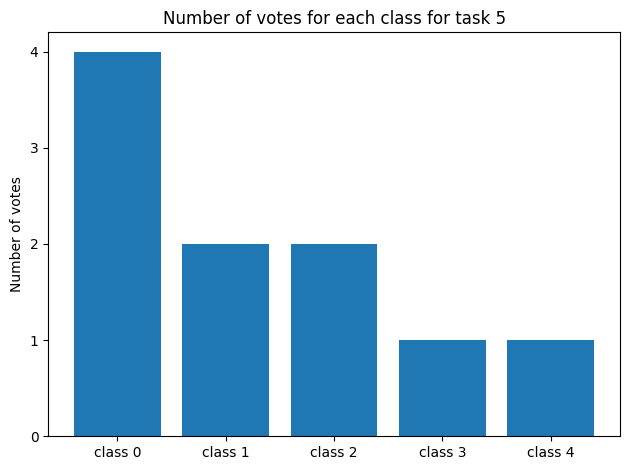
We can visualize the generated votes and the true labels of the tasks. For example let us consider task 5:
[2]:
import json
import numpy as np
import matplotlib.pyplot as plt

with open(path / "answers.json") as f:
    answers = json.load(f)
gt = np.load(path / "ground_truth.npy")

print("Task 5:", answers["5"])
print("Number of votes:", len(answers["5"]))
print("Ground truth:", gt[5])
fig, ax = plt.subplots()

counts = np.bincount(list(answers["5"].values()), minlength=5)
classes = [f"class {str(i)}" for i in [0, 1, 2, 3, 4]]

ax.bar(classes, counts)
plt.yticks(range(0, max(counts)+1))
ax.set_ylabel("Number of votes")
ax.set_title("Number of votes for each class for task 5")
plt.tight_layout()
plt.show()
Task 5: {'2': 1, '3': 0, '4': 0, '5': 3, '9': 0, '11': 1, '15': 2, '17': 4, '21': 0, '26': 2}
Number of votes: 10
Ground truth: 0
Command Line Aggregation
Let us run some aggregation methods on the dataset we just generated using the command line interface.
[3]:
for strat in ["MV", "NaiveSoft", "DS", "GLAD", "DSWC[L=5]", "Wawa"]:
    ! peerannot aggregate ../_build/notebooks/ -s {strat}
Traceback (most recent call last):
  File "/home/circleci/miniconda/bin/peerannot", line 8, in <module>
    sys.exit(peerannot())
  File "/home/circleci/miniconda/lib/python3.10/site-packages/click/core.py", line 1569, in __call__
    return self.main(*args, **kwargs)
  File "/home/circleci/miniconda/lib/python3.10/site-packages/click/core.py", line 1490, in main
    rv = self.invoke(ctx)
  File "/home/circleci/miniconda/lib/python3.10/site-packages/click/core.py", line 1970, in invoke
    return _process_result(sub_ctx.command.invoke(sub_ctx))
  File "/home/circleci/miniconda/lib/python3.10/site-packages/click/core.py", line 1353, in invoke
    return ctx.invoke(self.callback, **ctx.params)
  File "/home/circleci/miniconda/lib/python3.10/site-packages/click/core.py", line 907, in invoke
    return callback(*args, **kwargs)
  File "/home/circleci/project/peerannot/runners/run.py", line 267, in aggregate
    strat = agg_strategies[strat_name]
KeyError: 'mv'
Traceback (most recent call last):
  File "/home/circleci/miniconda/bin/peerannot", line 8, in <module>
    sys.exit(peerannot())
  File "/home/circleci/miniconda/lib/python3.10/site-packages/click/core.py", line 1569, in __call__
    return self.main(*args, **kwargs)
  File "/home/circleci/miniconda/lib/python3.10/site-packages/click/core.py", line 1490, in main
    rv = self.invoke(ctx)
  File "/home/circleci/miniconda/lib/python3.10/site-packages/click/core.py", line 1970, in invoke
    return _process_result(sub_ctx.command.invoke(sub_ctx))
  File "/home/circleci/miniconda/lib/python3.10/site-packages/click/core.py", line 1353, in invoke
    return ctx.invoke(self.callback, **ctx.params)
  File "/home/circleci/miniconda/lib/python3.10/site-packages/click/core.py", line 907, in invoke
    return callback(*args, **kwargs)
  File "/home/circleci/project/peerannot/runners/run.py", line 267, in aggregate
    strat = agg_strategies[strat_name]
KeyError: 'naivesoft'
Traceback (most recent call last):
  File "/home/circleci/miniconda/bin/peerannot", line 8, in <module>
    sys.exit(peerannot())
  File "/home/circleci/miniconda/lib/python3.10/site-packages/click/core.py", line 1569, in __call__
    return self.main(*args, **kwargs)
  File "/home/circleci/miniconda/lib/python3.10/site-packages/click/core.py", line 1490, in main
    rv = self.invoke(ctx)
  File "/home/circleci/miniconda/lib/python3.10/site-packages/click/core.py", line 1970, in invoke
    return _process_result(sub_ctx.command.invoke(sub_ctx))
  File "/home/circleci/miniconda/lib/python3.10/site-packages/click/core.py", line 1353, in invoke
    return ctx.invoke(self.callback, **ctx.params)
  File "/home/circleci/miniconda/lib/python3.10/site-packages/click/core.py", line 907, in invoke
    return callback(*args, **kwargs)
  File "/home/circleci/project/peerannot/runners/run.py", line 267, in aggregate
    strat = agg_strategies[strat_name]
KeyError: 'ds'
Running aggregation glad with options {}
- Running EM
Finished:  74%|████████████████████████▍        | 37/50 [00:29<00:10,  1.24it/s]
Task difficulty coefficients saved at /home/circleci/project/doc/_build/notebooks/identification/glad/difficulties.npy
Worker ability coefficients saved at /home/circleci/project/doc/_build/notebooks/identification/glad/abilities.npy
Aggregated labels stored at /home/circleci/project/doc/_build/notebooks/labels/labels_independent-confusion_glad.npy with shape (200, 5)
Traceback (most recent call last):
  File "/home/circleci/miniconda/bin/peerannot", line 8, in <module>
    sys.exit(peerannot())
  File "/home/circleci/miniconda/lib/python3.10/site-packages/click/core.py", line 1569, in __call__
    return self.main(*args, **kwargs)
  File "/home/circleci/miniconda/lib/python3.10/site-packages/click/core.py", line 1490, in main
    rv = self.invoke(ctx)
  File "/home/circleci/miniconda/lib/python3.10/site-packages/click/core.py", line 1970, in invoke
    return _process_result(sub_ctx.command.invoke(sub_ctx))
  File "/home/circleci/miniconda/lib/python3.10/site-packages/click/core.py", line 1353, in invoke
    return ctx.invoke(self.callback, **ctx.params)
  File "/home/circleci/miniconda/lib/python3.10/site-packages/click/core.py", line 907, in invoke
    return callback(*args, **kwargs)
  File "/home/circleci/project/peerannot/runners/run.py", line 267, in aggregate
    strat = agg_strategies[strat_name]
KeyError: 'dswc'
Running aggregation wawa with options {}
/home/circleci/project/peerannot/models/aggregation/wawa.py:61: UserWarning:
            Wawa aggregation only returns hard labels.
            Defaulting to ``get_answers()``.

  warnings.warn(
Aggregated labels stored at /home/circleci/project/doc/_build/notebooks/labels/labels_independent-confusion_wawa.npy with shape (200,)
Now, as we know the ground truth we can evaluate the performance of the aggregation methods. In this example we consider the accuracy. Other metrics such as F1-scores, precision, recall, etc. can be used.
[4]:
import pandas as pd

def accuracy(labels, gt):
    return np.mean(labels == gt) if labels.ndim == 1 else np.mean(np.argmax(labels, axis=1) == gt)

results = {  # initialize results dictionary
    "mv": [],
    "naivesoft": [],
    "glad": [],
    "ds": [],
    "wawa": [],
    "dswc[l=5]": [],
}
for strategy in results.keys():
    path_labels = path / "labels" / f"labels_independent-confusion_{strategy}.npy"
    labels = np.load(path_labels)  # load aggregated labels
    results[strategy].append(accuracy(labels, gt))  # compute accuracy
results["NS"] = results["naivesoft"]  # rename naivesoft to NS
results.pop("naivesoft")

# Styling the results
results = pd.DataFrame(results, index=["AccTrain"])
results.columns = map(str.upper, results.columns)
results = results.style.set_table_styles(
    [dict(selector="th", props=[("text-align", "center")])]
)
results.set_properties(**{"text-align": "center"})
results = results.format(precision=3)
results
---------------------------------------------------------------------------
FileNotFoundError                         Traceback (most recent call last)
Cell In[4], line 16
     14 for strategy in results.keys():
     15     path_labels = path / "labels" / f"labels_independent-confusion_{strategy}.npy"
---> 16     labels = np.load(path_labels)  # load aggregated labels
     17     results[strategy].append(accuracy(labels, gt))  # compute accuracy
     18 results["NS"] = results["naivesoft"]  # rename naivesoft to NS

File ~/miniconda/lib/python3.10/site-packages/numpy/lib/_npyio_impl.py:451, in load(file, mmap_mode, allow_pickle, fix_imports, encoding, max_header_size)
    449     own_fid = False
    450 else:
--> 451     fid = stack.enter_context(open(os.fspath(file), "rb"))
    452     own_fid = True
    454 # Code to distinguish from NumPy binary files and pickles.

FileNotFoundError: [Errno 2] No such file or directory: '../_build/notebooks/labels/labels_independent-confusion_mv.npy'
API Aggregation
We showed how to use the command line interface, but what about the API? It’s just as simple!
[5]:
from peerannot.models import agg_strategies

strategies = ["MV", "GLAD", "DS", "NaiveSoft", "DSWC", "Wawa"]
yhats = []
for strat in strategies:
    agg = agg_strategies[strat]
    if strat != "DSWC":
        agg = agg(answers, n_classes=5, n_workers=30, n_tasks=200, dataset=path)
    else:
        agg = agg(answers, L=5, n_classes=5, n_workers=30, n_tasks=200)
    if hasattr(agg, "run"):
        agg.run(maxiter=20)
    yhats.append(agg.get_answers())
/home/circleci/miniconda/lib/python3.10/site-packages/tqdm/auto.py:21: TqdmWarning: IProgress not found. Please update jupyter and ipywidgets. See https://ipywidgets.readthedocs.io/en/stable/user_install.html
  from .autonotebook import tqdm as notebook_tqdm
---------------------------------------------------------------------------
KeyError                                  Traceback (most recent call last)
Cell In[5], line 6
      4 yhats = []
      5 for strat in strategies:
----> 6     agg = agg_strategies[strat]
      7     if strat != "DSWC":
      8         agg = agg(answers, n_classes=5, n_workers=30, n_tasks=200, dataset=path)

KeyError: 'MV'
[6]:
results = {  # initialize results dictionary
    "mv": [],
    "glad": [],
    "ds": [],
    "naivesoft": [],
    "dswc[l=5]": [],
    "wawa": [],
}
for i, strategy in enumerate(results.keys()):
    labels = yhats[i] # load aggregated labels
    results[strategy].append(accuracy(labels, gt))  # compute accuracy
results["NS"] = results["naivesoft"]  # rename naivesoft to NS
results.pop("naivesoft")

# Styling the results
results = pd.DataFrame(results, index=["AccTrain"])
results.columns = map(str.upper, results.columns)
results = results.style.set_table_styles(
    [dict(selector="th", props=[("text-align", "center")])]
)
results.set_properties(**{"text-align": "center"})
results = results.format(precision=3)
results
---------------------------------------------------------------------------
IndexError                                Traceback (most recent call last)
Cell In[6], line 10
      1 results = {  # initialize results dictionary
      2     "mv": [],
      3     "glad": [],
   (...)
      7     "wawa": [],
      8 }
      9 for i, strategy in enumerate(results.keys()):
---> 10     labels = yhats[i] # load aggregated labels
     11     results[strategy].append(accuracy(labels, gt))  # compute accuracy
     12 results["NS"] = results["naivesoft"]  # rename naivesoft to NS

IndexError: list index out of range
The difference in performance shown result from the random tie-breaks generated.