Pl@ntNet aggregation strategy
This aggregation strategy presented in this paper models the expertise of users the number of labels they correctly interact with.
Let us create a toy-dataset to run it with 4 users, 20 items and 9 classes.
The full Pl@ntNet-CrowdSWE dataset is available on zenodo with more than 6.5M items, 850K users and 11K classes.
Each item (e.g a plant observation) has been labeled by at least a single user. The ground truth is simulated, so everything is known to measure the accuracy (amongst other metrics). Each item has an authoring user (the picture is taken and uploaded by a user). In the algorithm authoring users and users that vote on others’ items are treated differently.
[1]:
import numpy as np
import peerannot.models as pmod
from tqdm.auto import tqdm
import matplotlib.pyplot as plt

# Crowdsourced answers (are stored typically in a .json file)
votes = {
    0: {0: 2, 1: 2, 2: 2},
    1: {0: 6, 1: 2, 3: 2},
    2: {1: 8, 2: 7, 3: 8},
    3: {0: 1, 1: 1, 2: 5},
    4: {2: 4},
    5: {0: 0, 1: 0, 2: 1, 3: 6},
    6: {1: 5, 3: 3},
    7: {0: 3, 2: 6, 3: 4},
    8: {1: 7, 3: 7},
    9: {0: 8, 2: 1, 3: 1},
    10: {0: 0, 1: 0, 2: 1},
    11: {2: 3},
    12: {0: 7, 2: 8, 3: 1},
    13: {1: 3},
    14: {0: 5, 2: 4, 3: 4},
    15: {0: 5, 1: 7},
    16: {0: 0, 1: 4, 3: 4},
    17: {1: 5, 2: 7, 3: 7},
    18: {0: 3},
    19: {1: 7, 2: 7},
}

# Ground truth (gt) and authors of the observations
authors = [0, 0, 1, 0, 2, 0, 1, 0, 3, 1, 1, 3, 0, 1, 0, 1, 0, 1, 0, 1]
gt = [2, 6, 4, 1, 1, -1, 3, -1, 2, 8, 4, 1, 7, 0, 5, 5, 0, -1, 6, 7]
np.savetxt("authors_toy.txt", authors, fmt="%i")
/home/circleci/miniconda/lib/python3.10/site-packages/tqdm/auto.py:21: TqdmWarning: IProgress not found. Please update jupyter and ipywidgets. See https://ipywidgets.readthedocs.io/en/stable/user_install.html
  from .autonotebook import tqdm as notebook_tqdm
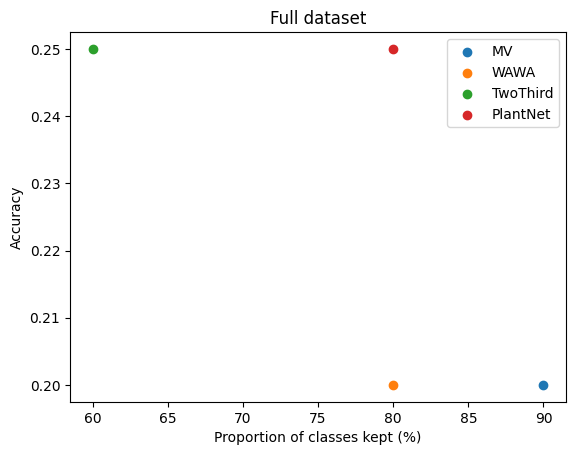
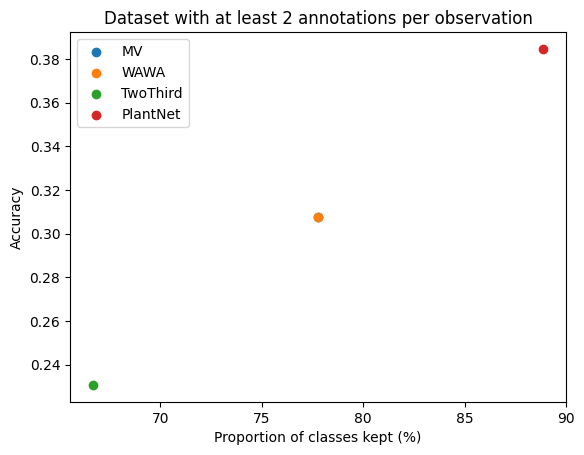
We will evaluate the performance of the method on two subsets: - The full dataset - The subset where the items have been voted on by more than two users We also monitor the proportion of classes retrieved after the aggregation compared to the ground truth (if a class is never predicted by the aggregation, a model can later never be trained to recognize it).
[2]:
def build_mask_more_than_two(answers, gt):
mask = np.zeros(len(answers), dtype=bool)
for tt in tqdm(answers.keys()):
if len(answers[tt]) >= 2 and gt[int(tt)] != -1:
mask[int(tt)] = 1
return mask
mask_more_than_two = build_mask_more_than_two(votes, gt)
def build_mask_more_than_two(answers, gt):
mask = np.zeros(len(answers), dtype=bool)
for tt in tqdm(answers.keys()):
if len(answers[tt]) >= 2 and gt[int(tt)] != -1:
mask[int(tt)] = 1
return mask
mask_more_than_two = build_mask_more_than_two(votes, gt)
# %% Metric to compare the strategies where the ground truth is available (proportion of classes kept and accuracy)
def vol_class_kept(preds, truth, mask):
uni_test = np.unique(truth[mask])
n_class_test = uni_test.shape[0]
preds_uni = np.unique(preds[mask])
if preds_uni[0] == -1:
preds_uni = preds_uni[1:]
n_class_pred = preds_uni.shape[0]
n_common = len(set(preds_uni).intersection(set(uni_test)))
vol_kept = n_common / n_class_test * 100
return n_class_pred, n_class_test, vol_kept
def accuracy(preds, truth, mask):
return np.mean(preds[mask] == truth[mask])
100% 20/20 [00:00<00:00, 218453.33it/s]
100% 20/20 [00:00<00:00, 363143.20it/s]
We now run the Pl@ntNet strategy against other strategies available in peerannot.
Each strategy is first instanciated. The .run method is called if any optimization procedure is necessary. Estimated labels are recovered with the .get_answers() method.
[3]:
mv = pmod.MV(answers=votes, n_classes=9, n_workers=4)
yhat_mv = mv.get_answers()
wawa = pmod.Wawa(answers=votes, n_classes=9, n_workers=4)
wawa.run()
yhat_wawa = wawa.get_answers()
twothird = pmod.TwoThird(answers=votes, n_classes=9, n_workers=4)
yhat_twothird = twothird.get_answers()

# %% run the PlantNet aggregatio
pn = pmod.PlantNet(
    answers=votes,
    n_classes=9,
    n_workers=4,
    alpha=0.5,
    beta=0.2,
    authors="authors_toy.txt",
)
pn.run(maxiter=5, epsilon=1e-9)
yhatpn = pn.get_answers()
100% 5/5 [00:00<00:00, 3188.13it/s]
Finally we plot the metrics considered
[4]:
# %% Compute the metrics for each strategy
res_full = []
res_more_than_two = []
vol_class_full = []
vol_class_more_than_two = []

gt = np.array(gt)
strats = ["MV", "WAWA", "TwoThird", "PlantNet"]

for strat, res in zip(strats, [yhat_mv, yhat_wawa, yhat_twothird, yhatpn]):
    res_full.append(accuracy(res, gt, np.ones(len(gt), dtype=bool)))
    vol_class_full.append(vol_class_kept(res, gt, np.ones(len(gt), dtype=bool))[2])
    res_more_than_two.append(accuracy(res, gt, mask_more_than_two))
    vol_class_more_than_two.append(vol_class_kept(res, gt, mask_more_than_two)[2])
# %% Plot the accuracy against the proportion of classes kept
plt.figure()
for i, strat in enumerate(strats):
    plt.scatter(vol_class_full[i], res_full[i], label=strat)
plt.title(r"Full dataset")
plt.ylabel("Accuracy")
plt.xlabel("Proportion of classes kept (%)")
plt.legend()
plt.show()

plt.figure()
for i, strat in enumerate(strats):
    plt.scatter(vol_class_more_than_two[i], res_more_than_two[i], label=strat)
plt.title(r"Dataset with at least 2 annotations per observation")
plt.ylabel("Accuracy")
plt.xlabel("Proportion of classes kept (%)")
plt.legend()
plt.show()

